National Electrical Safety Month
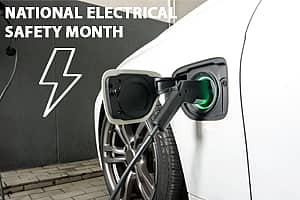
Each May ESFI commemorates National Electrical Safety Month (NESM) to raise awareness about critical electrical safety topics.
Each May ESFI commemorates National Electrical Safety Month (NESM) to raise awareness about critical electrical safety topics.
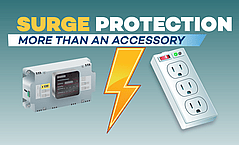
Surge Protection Devices – They’re More than an Accessory, They’re a Necessity. A power surge is a sudden and unwanted increase in voltage that can damage, degrade, or destroy electronic equipment.
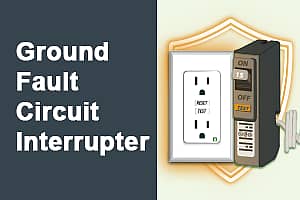
Ground Fault Circuit Interrupters have saved thousands of lives since their introduction in to the National Electrical Code in the 1970s.