Electrical Safety Foundation International
  • About Us
  • News
  • Support ESFI
  • EspaƱol
  • Contact Us
  • Facebook
  • Twitter
  • Youtube
  • Linked In
  • Home Safety
    • Electrical Safety
    • Fire Prevention
    • Home Safety Devices
    • Your Home Electrical System
    • Seasonal Safety

    Bring Electrical Safety Home


    Protect your home and family from electrical hazards and fires.


  • Workplace Safety
    • Industry Codes & Regulations
    • Standards & Best Practices
    • Workplace Injury & Fatality Statistics
    • Electrical Safety Self-Assessment
    • Overhead Power Line Safety

    Make Electrical Safety a Business Priority


    Safe work practices are vital to everyone in your business.


  • Disaster Safety
    • Home Disaster Safety
    • Commercial & Industrial Disaster Safety
    • Disaster Recovery
    • Electric-Shock Drowning

    Weather the Storm


    New and updated storm safety resources to keep homes and businesses safe during severe weather

  • Kids Safety
    • Be Smart About Fire & Electrical Safety
    • ESFI's Approach to Electrical Safety
    • Elementary Educational Resources
    • Four Seasons of Safety

    Elementary Education Resources


    Curiosity is a natural part of childhood learning, but it can be extremely dangerous when it comes to electricity.


  • Programs and Initiatives
    • National Electrical Safety Month
    • Holiday Safety
    • National Electrical Code
    • Ground Fault Circuit Interrupters
    • Surge Protective Devices
    • Fire Prevention
    • Tamper Resistant Receptacles (TRRs)
    • Arc Fault Circuit Interrupters (AFCIs)
    • Zero Tolerance for Counterfeits

    ESFI's Programs and Initiatives


    Get the latest information on National Electrical Safety Month, Fire Prevention Week and more!


  • Resource Library

Workplace Fatalities and Injuries 2003 - 2017

Posted 01.29.2019 in Workplace Safety
Download Attachment

Workplace Fatalities and Injuries 2003 - 2017

The Electrical Safety Foundation International (ESFI) uses the U.S. Bureau of Labor Statistics’ (BLS) Census of Fatal Occupational Injuries (CFOI) and Survey of Occupational Injuries (SOII) to distill information specifically pertaining to fatal and nonfatal occupational electrical injuries. Each year the ESFI publishes electrical injury information in tabular and graphical form on our website. The most recent data covers the 24 year period from 1992-2017, but mainly focuses on 2003-2017 data. Download data and charts

Workplace Electrical Safety

Bureau of Labor Statistics Census 2017 Census of Fatal Occupational Injuries
Released December 18, 2018

2017 Workplace Electrical Safety Highlights:

Fatal Electrical Injuries

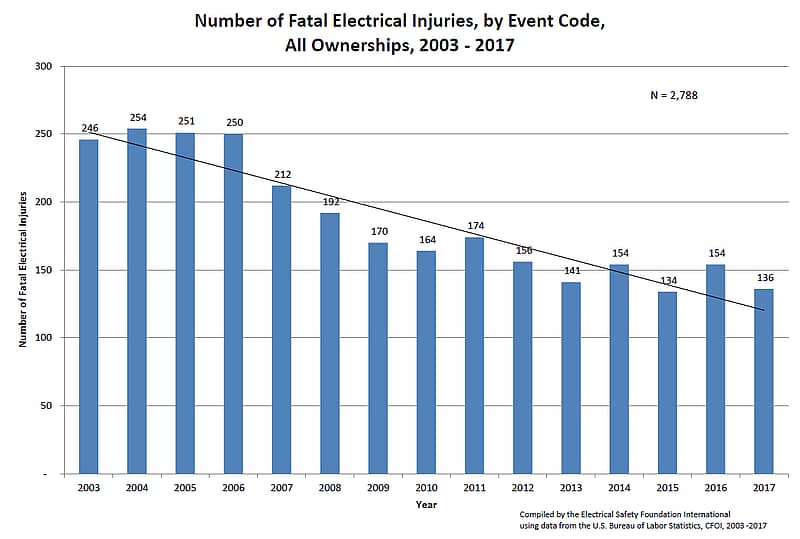
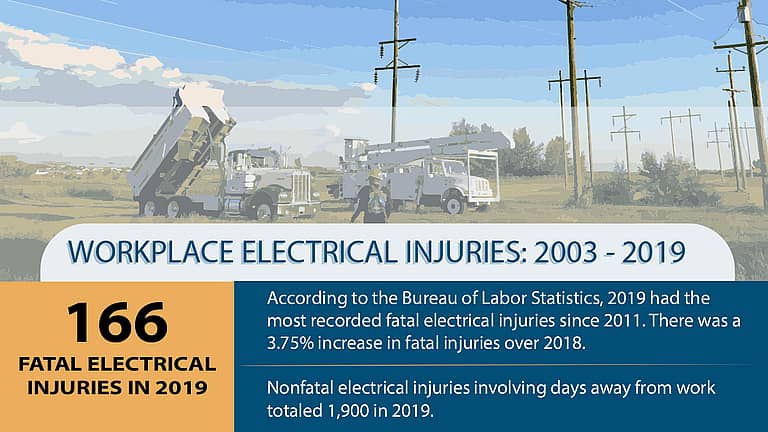
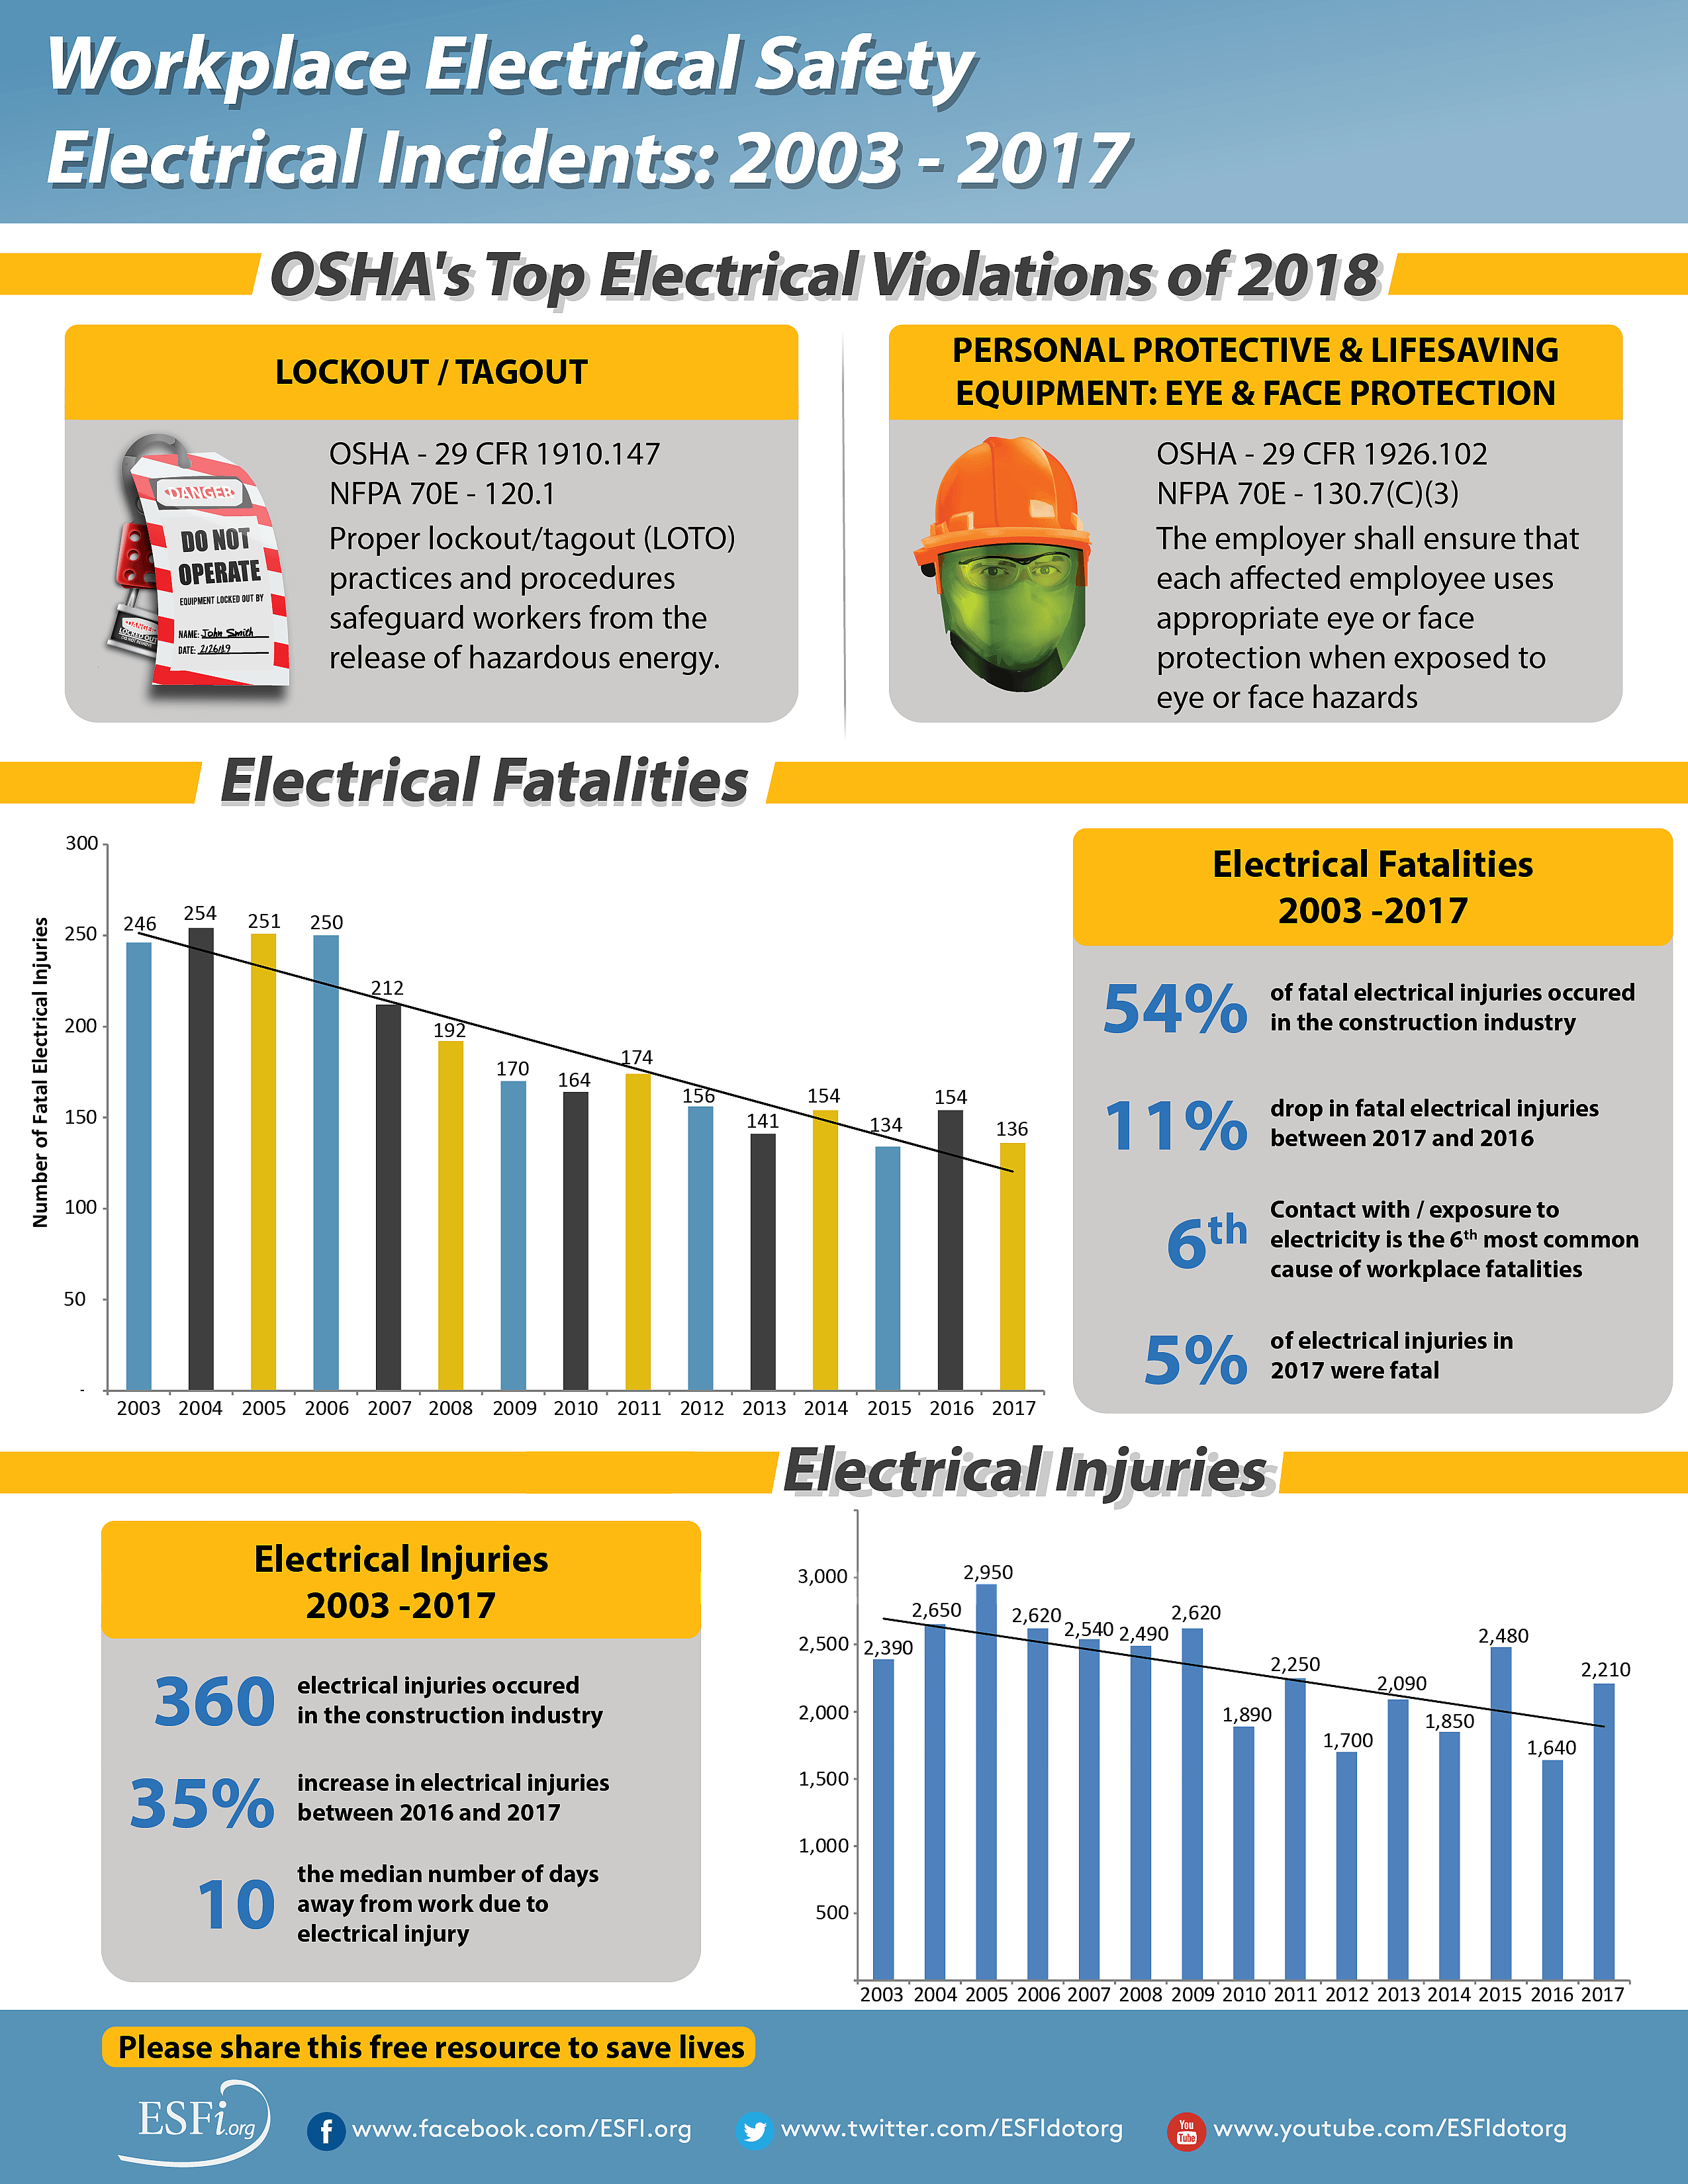
  • There were 136 electrical fatalities in 2017. An 11.6% drop from 2016, returning to 2015 levels.
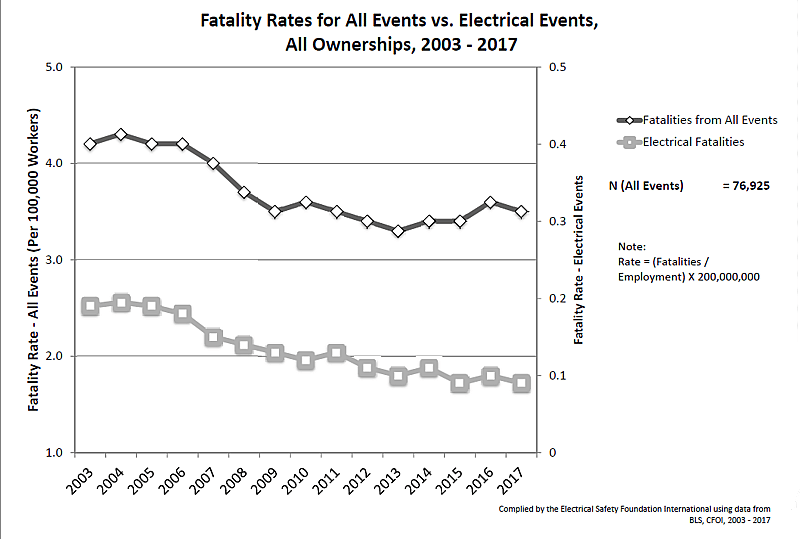
  • Contact with / Exposure to electric current accounted for 2.6% of all workplace fatalities. In 2016, they accounted for 2.9%, in 2015 2.7% and 3.1% in 2014.
  • Contact with / Exposure to electric current maintained its position as sixth most common type of workplace fatality.
  • Electrocutions accounted for all but one of the workplace electrical fatalities.
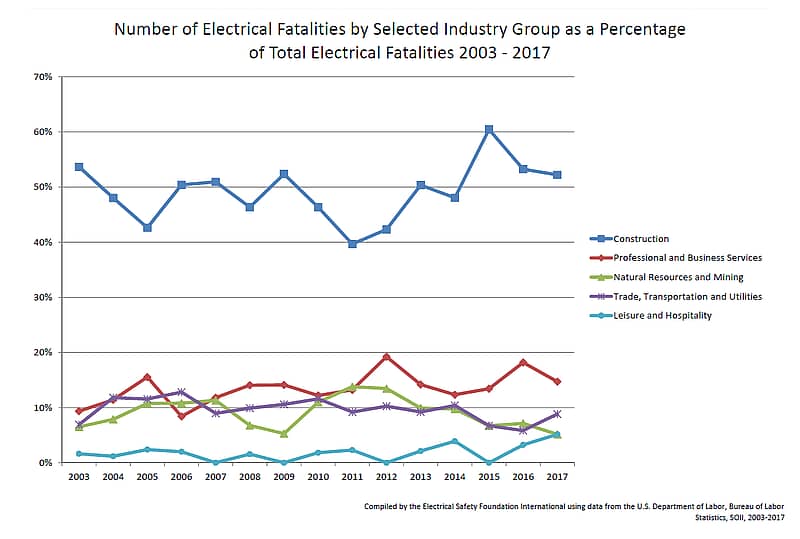
  • 54% of all fatal electrical injuries occurred in the construction industry compared to 53% in 2016. The second leading industry in electrical fatalities in professional and business services with 20 fatalities (15%).
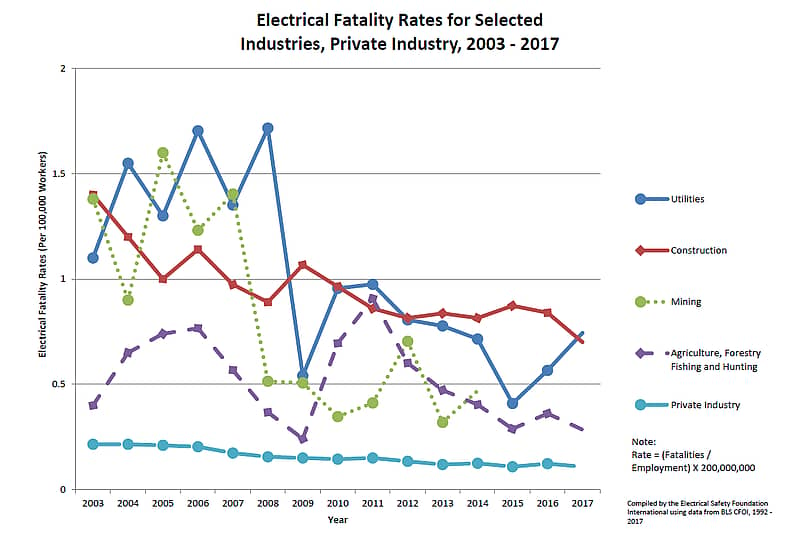
  • The utility industry had the highest rate of fatal electrical injuries (0.74 / 100,000) followed by construction (0.70/ 100,000)
  • Electrical fatalities account for 5.7% of all electrical injuries.
  • Good producing private industries (natural resources and mining, construction, manufacturing) accounted for 64.9% of fatal electrical injuries compared to 35.1% fatal injuries from service-providing private industries maintaining 2016 numbers
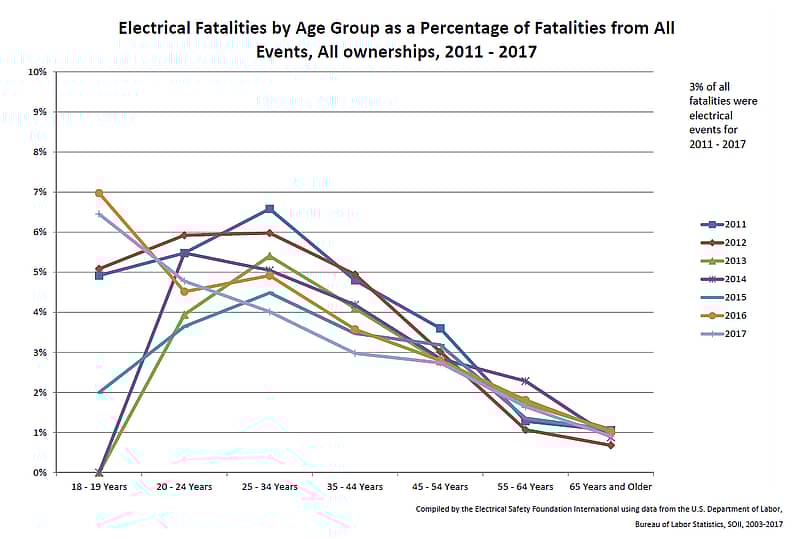
  • Younger workers are more likely to experience electrical injuries:
    • Workers 16 to 17 years of age experienced electrical fatalities at 5.4 times the average for all age groups;
    • 18 to 19 age group – 2.4 times;
    • 20 – 24 age group – 1.8 times;
    • 25 – 34 age group – 1.5 times;
    • 35 – 44 age group – 1.1 times;
    • Those 45 years and up are at or below the average

Nonfatal Electrical Injuries

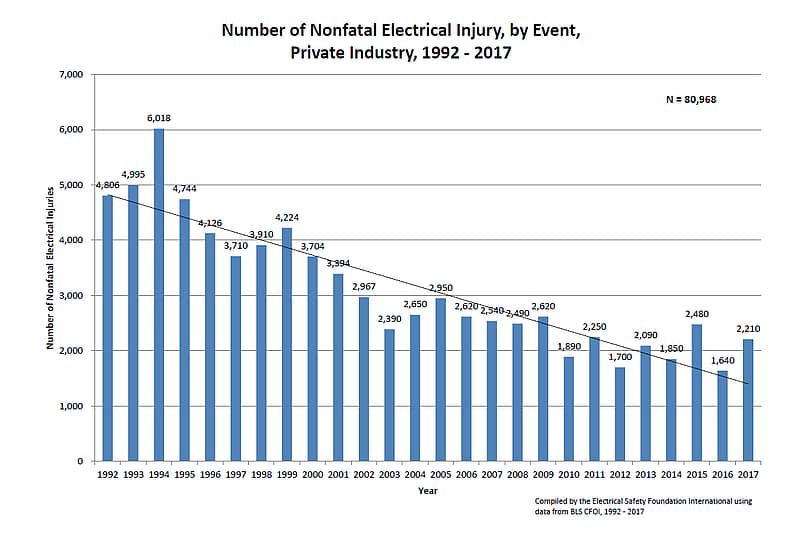
  • There were 2,210 nonfatal electrical injuries in 2017, an increase of 35% over 2016, and a decrease of 10% over 2015.
  • 0.25% of all nonfatal injuries resulting in days away from work could be attributed to electricity during 2017.
  • The median number of days away from work for nonfatal electrical injuries was 10, double that of 2016 and the highest number since 2013.
  • The industries with the leading number of nonfatal electrical injuries:
    • Construction – 360 (16%)
    • Real Estate and Rental and Leasing – 330 (15%)
    • Professional, Scientific, and Technical Services – 290 (13%)
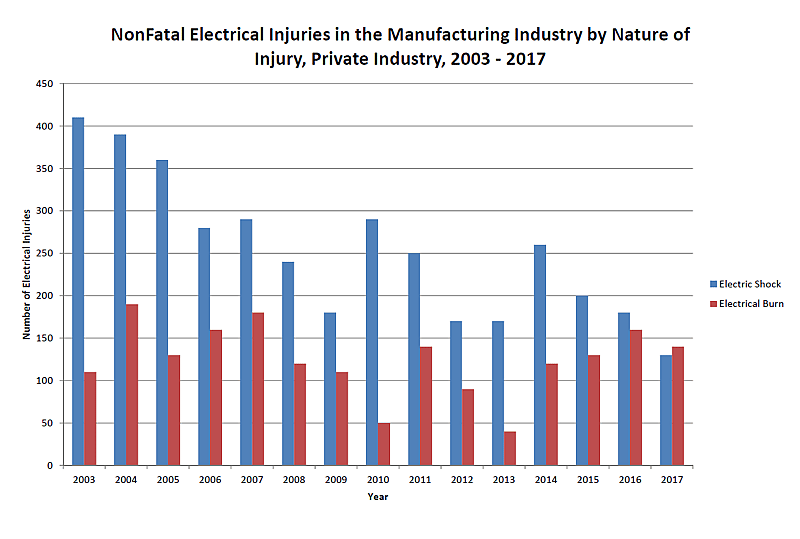
    • Manufacturing – 260 (12%)
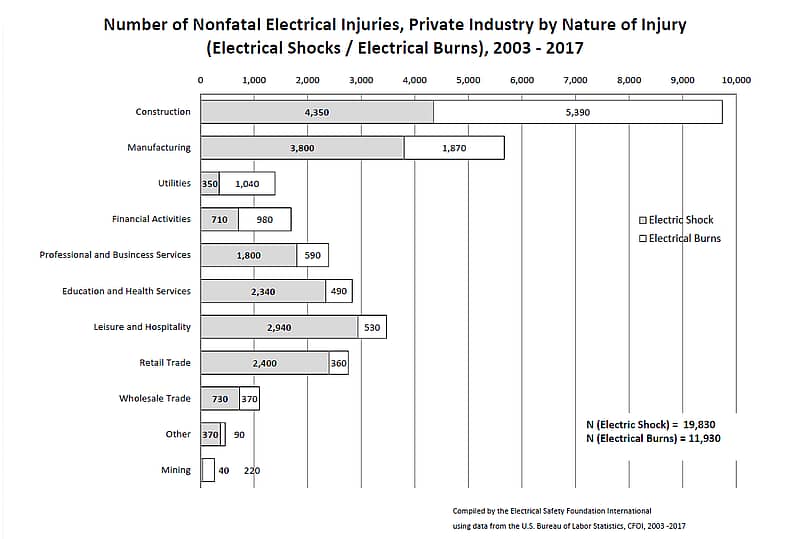
  • Shocks accounted for 1,330 nonfatal electrical injuries, while burns accounted for 900.
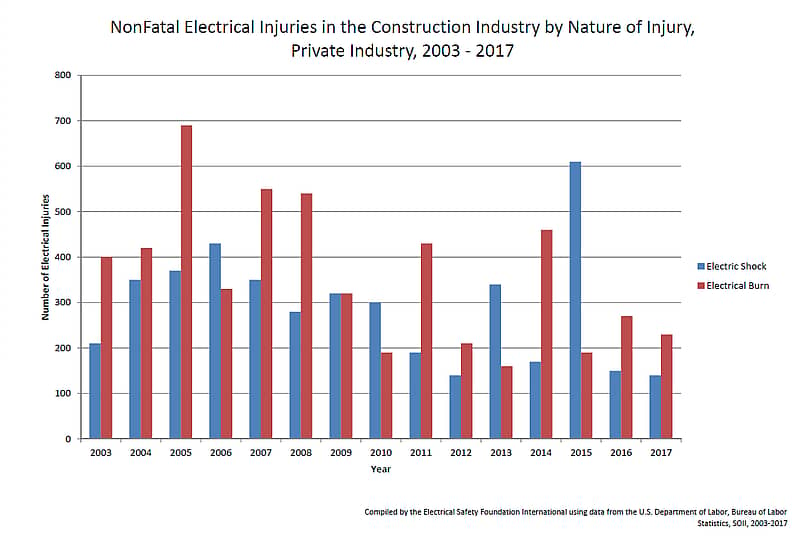
    • 140 shocks and 230 burns occurred in the construction industry.
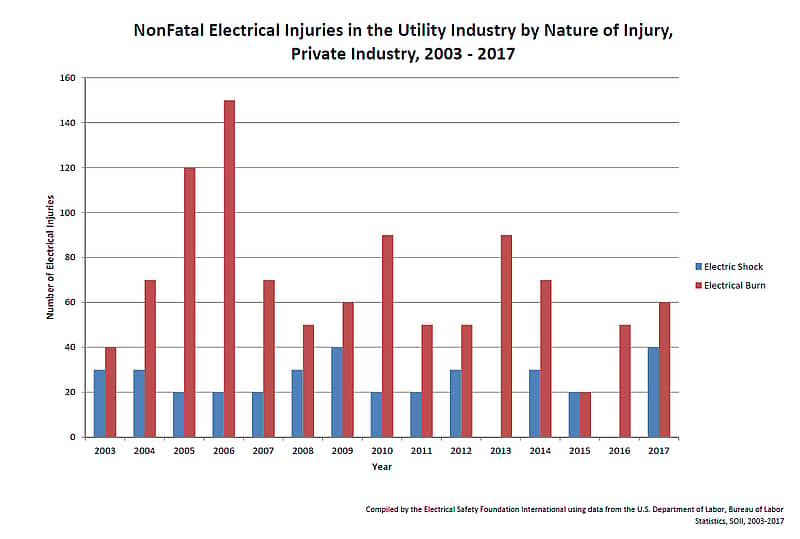
    • 40 shocks and 60 burns occurred in the utility industry
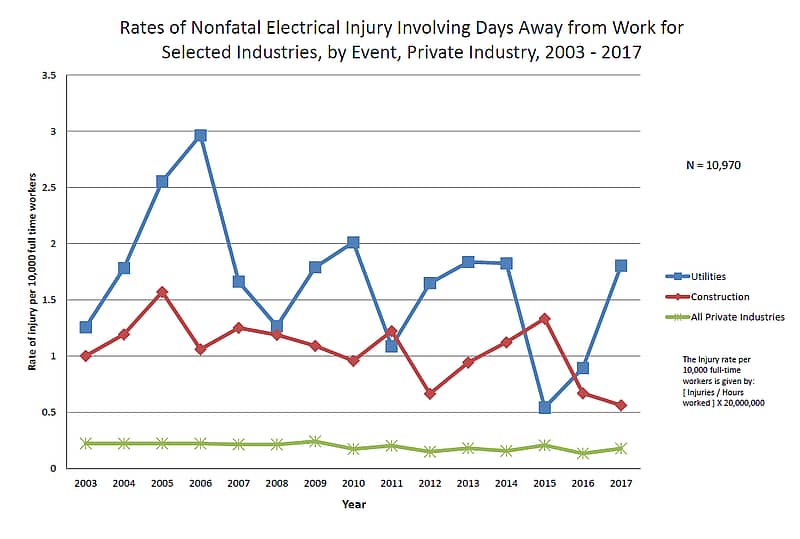
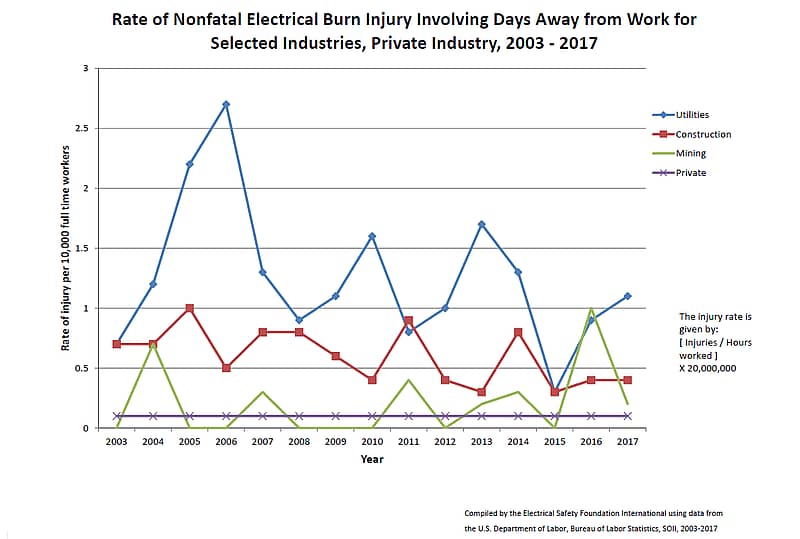
  • Utilities had the highest rate of electrical injuries with 1.8 /10,000 workers. Construction only had 0.6 / 10,000 workers.
    • Real estate and rental and leasing had the second highest rate with 1.7 / 10,000 workers.
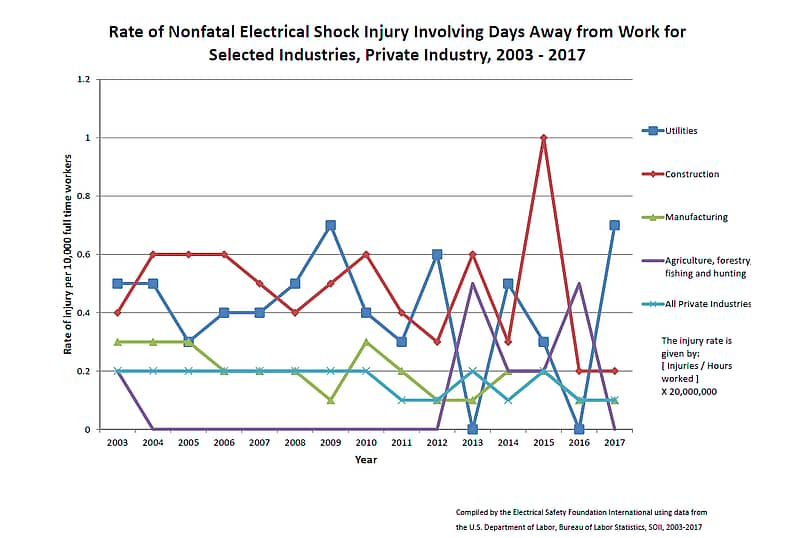
  • The highest rate of nonfatal electrical shock was in the Arts, entertainment, and recreation industry with 1.1 / 10,000 workers. Utilities had 0.7 / 10,000 workers while construction had 0.2 / 10,000.
  • The highest rate of nonfatal electrical burns was in the Real estate and rental industry with 1.6 / 10,000 workers. Utilities had 1.1 / 10,000 workers while construction had 0.4 / 10,000.

Figure 01 - Number of Fatal Electrical Injuries All Ownerships 2003 - 2017

Figure 02 - Fatality Rate for All Events vs Electrical Events All Ownerships 2003 - 2017

Figure 03 - Electrical Fatalities by Age Group All Events All Ownerships 2011 - 2017Figure 04 - Number of Electrial Fatalities by percentage 2003 - 2017Figure 05 - Electrical Fatality Rates for Selected Inustries Private Industry 2003 - 2017

Figure 06 - Number of Nonfatal Electrical Injury by Event Private Industry 1992 - 2017

Figure 07 - Number of NonFatal Electrical Injuries by Nature of Injury Private Industry 2003 - 2017

Figure 07a - Number of NonFatal Electrical Injuries by Nature of Injury Construction 2003 - 2017

Figure 07b - Number of NonFatal Electrical Injuries by Nature of Injury Manufacturing 2003 - 2017

Figure 07c - Number of NonFatal Electrical Injuries by Nature of Injury Utility 2003 - 2017

Figure 08 - Rates of Nonfatal Electrical Injury 2003 - 2017

Figure 09 - Rates of Nonfatal SHOCK

Figure 10 - Rates of Nonfatal BURN

Workplace Safety
    Workplace Safety
Download Attachment

Related News & Resources

Workplace Fatalities and Injuries 2003 - 2019
Read Download
Workplace Fatalities and Injuries 2003 - 2018
Read Download
Workplace Safety - Limits of Approach - Always Look Up
Read Download

Join the Electrical Industry

  • Home
  • About Us
  • Board of Directors
  • Contact Us
  • Facebook
  • Twitter
  • Youtube
  • Linked In
Our Supporters View All
The Harvey Hubbell Foundation

Conney Safety
Conney Safety

Intertek
Intertek

Encore Wire Corporation

Electrical Safety Foundation International (ESFI)
1300 17th Street North, Suite 900, Arlington, Virginia 22209
Tel 703-841-3229 Fax 703-841-3329
© 2021 All Rights Reserved
Powered by Getfused